Results Viewer


|
Results Viewer |
|
|
Standalone DesignBuilder Results Viewer The Results Viewer is a separate application which can be used to view EnergyPlus results stored in one or more .eso files. It can be downloaded from the main Downloads > Software area of the DesignBuilder website. When installed the application allows you to view any results contained within EnergyPlus .eso and .htm results files. There are 3 ways to open .eso results files:
Multiple .eso and .htm files can be opened at a time. Use the combo box below the toolbar to select the current results set for plotting.
With an .eso file open the first view will be something like that shown below.
DISPLAY RESULTS To show results for a particular interval use the Frequency drop list to select the interval.
Sorting the Reports can be a useful way to help find particular data and can be achieved by clicking on the column headers. For example to see data sorted by "Area" click on the Area header. This will collect together all data for each zone, HVAC component, Environment etc. in the list.
To plot a report on a graph use one of these methods:
Selecting a graph If you have more than 1 graph set up you can select the current graph simply by clicking on it. You will see the graph heating highlight in a different blue when selected as shown below.
MENU COMMANDS You can access a range of options from the top bar menu, toolbar and right-click context menus. These are as follows: Display grid Display the data as a grid instead of a graph. Display graph Display the data as a graph instead of a grid. Save grid to CSV Allows you to save the data as a comma separated values file for loading into a spreadsheet for further analysis. Copy graphs to another frequency If you have generated similar data for multiple frequencies then use this tool to use settings for the current frequency and display the same reports using a different frequency. Change main title Change the text to be used for the main title for all graphs Rename graph title Allows you to change the title for the currently selected graph. To change the name of the current graph right-click on the graph and from the DesignBuilder Options, select the Rename graph title option. Enter the title for the graph in the dialog and press OK. Remove selected graph Deletes the current graph. Any data displayed in the graph is unaffected. Cross hair on/off Checking this option displayed a cross hair which allows you to create a vertical and horizontal line when you click on a data point. It can be useful to check simultaneous values for a range of reports. Template Load/Save When you create graphs with Results Viewer, they are styled (e.g. Title Font, Background colour, etc) using a default styling template. You can change the styling defaults to your own preferences by using the right-hand context menu on the graph pane. The following options are currently available:
If you make some changes and want to revert back to the default styling at any time, select the Tools > Restore Graph Styling menu option.
Any styling changes made to the currently open session will be made permanent once the session has been saved.
If you wish to reuse your styling changes, you can save these to a styling template file and apply them to other sessions. Use the Tools> Template > Save option to save your styling template as a standalone file, ie outside of the session (note: the '.drt' file extension is used for styling template files). The Tools > Template > Load option can then be used to apply this style to another session. LOADING MULTIPLE DATA SETS You can load as many data sets as required to a single Results Viewer session by using the Open eso/Dataset menu or toolbar option. A list is maintained of all data sets currently opened in the drop list at the top of the window.
When you have more than one data set open it usually helps to Include the dataset name in the legend. This can be done from the Options dialog. OPTIONS DIALOG The Options dialog is accessed either from the toolbar Autosave session Select this option if you would like the session to be saved automatically when closing the Results Viewer. Display a title for each graph Selecting this option causes the title of each graph to be displayed for each graph as shown in highlighted areas in the graph below.
To change the name of the current graph right-click on the graph and from the DesignBuilder Options, select the Rename graph title option. Enter the title for the graph in the dialog and press OK. Include dataset name in legend If you have more than one data set loaded then you should usually select this option to ensure that the data set name is included in the legend. This can help when comparing results for different simulations.
The output above shows how the dataset name is added to each legend. Include folder name in dataset name If you include the dataset name in the legend then do you want the folder name included too? If so check this option. This option is only usually used when the result sets are stored in files with the same name but in different folders. ZOOMING In some cases you may find that too much data is displayed on the X-axis at one time and you need to focus on a section (time period) of the results graph. You can use the mouse to do this simply by dragging a time region of interest. This allows you to zoom in on data for particular days.
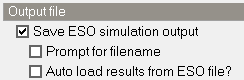
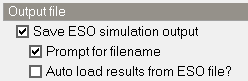
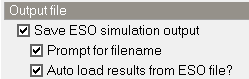
To return back to the original "un-zoomed" state, use the Undo zoom toolbar option. SESSIONS It can take some time to load.eso files and to select results so DesignBuilder provides methods to save pre-processed results files and session files to speed loading and setting up reports the next time. .drb results files When the Results Viewer loads an .eso file it automatically generates a .drb file with exactly the same data but in a form that can be loaded much more quickly. If you need to view the results again in future you can open the drb file instead of the .eso file. The .drb file will have the same filename as the original .eso file (apart from the extension). It does not contain any display settings - just the data. .drs results files You can also save a session file which stores all of your display settings for a graphing session as well as the corresponding .drb file(s). Opening the session file will take you back to where you were before saving the session file. Session files provide a very useful way to package up all data and settings for a Results Viewer session in a small file size. They can be sent to colleagues for viewing. You can configure DesignBuilder to save.eso files in various ways as described for the EnergyPlus tab of the Program options. If you plan to use the Results Viewer in favour of the inbuilt DesignBuilder results display then you might use one of the settings configurations below:
|