EnergyPlus Daylight Map Output


|
EnergyPlus Daylight Map Output |
|
|
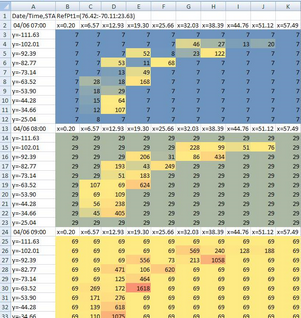
EnergyPlus generates a file called eplusmap.csv when one or more zones have daylight control and the Daylight map simulation output option has been selected for those zones. This file contains a series of grids for each zone with daylight controls and having daylight map output requested and for each hour of the day in the simulation. The example output below shows some graphical output for 3 hours for a zone using a spreadsheet with cells shaded based on illuminance values. This is done using a macro as described in a forum article by Jean Marais.
More sophisticated daylight analysis tools using Radiance are also available on the Daylighting screen.
|